

How To Read a Pump Curve
Knowing how to read a pump curve (also called ‘pump flow curve’ or ‘pump performance curve’) is essential to understanding the performance of a diaphragm pump within a specific set of operating conditions. The pump curve displays a selection of variable indicators to identify whether the pump can achieve the required flow rate at a certain pressure difference. This is critical in selecting the right pump for a specific application. We will provide instructions on how to read a pump curve correctly while looking further into the definitions and the variables each can display.
What Is a Pump Performance Curve Chart?
A pump performance curve chart is a graphical representation to illustrate a pump's performance capabilities across a rated flow and pressure range at various operating points. Understanding how to read a pump curve chart will help determine all possible operating points of a pump and allows the proper pump selection for a specific application.
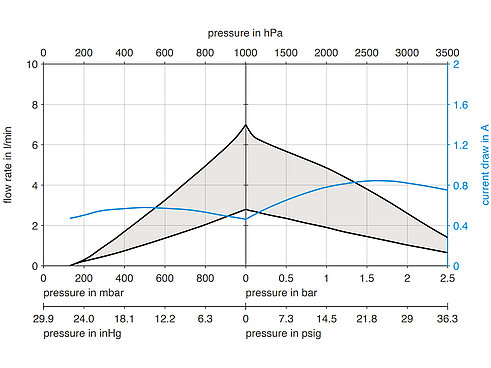
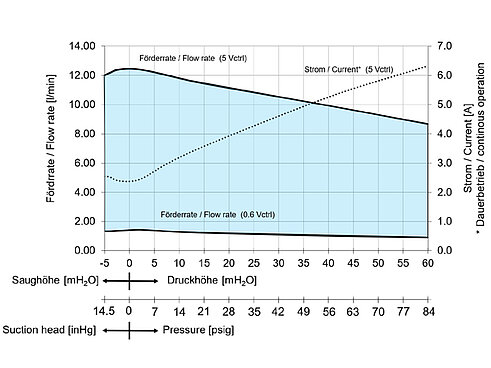
A typical curve chart will show pressure on the x-axis, and flow rate on the y-axis. The flow rate is usually measured in l/min for both gas pumps and liquid pumps alike. While pressure for gas pumps is usually measured in bar or PSI, the metric mH2O can be used in addition to bar or PSI when displaying liquid pump curves. The curve may also show a central vertical line separating the diagram into two sections, depending on the application. The left side represents vacuum applications and the pressure on the x-axis is presented as absolute pressure at the suction side of the pump. For this application, the outlet pressure on the pressure side is kept constant at 1000 mbar (ambient pressure). The right side represents pressure applications. Here, the x-axis shows the outlet pressure of the pump, displaying relative pressure to an ambient pressure of 1000 millibar. In this case, the inlet pressure is kept constant at 1000 mbar. For gas diaphragm pumps, the pressure is measured in bar and for liquid pumps it is measured in mH2O or inHg.
The farthest two points along the x-axis indicate the ultimate vacuum (on the left) and the maximum pressure (on the right) the pump can reach. At each left and right point, the flow rate drops to zero. Depending on the pump type and its permissible operating range, these points may not be displayed in every chart, as they only focus on the relevant operating ranges.
The highest point of the curve is where the two curves meet the central line. This is the pump’s free (or maximum) flow rate and indicates there is no restriction or pressure difference between suction (inlet) to pressure side (outlet) of the pump.
To use a pump performance curve chart, first determine the required application (vacuum or pressure), the required flow rate and pressure difference between pump inlet and outlet for the necessary application. Locate the points on the curve chart that correspond to these values and ensure that the pump can operate effectively. When choosing a pump, you might also have to consider the pump's behavior at this operating point, its power consumption, and any other factors depending on the specific application. In case you are searching for a pump that has to transfer media from vacuum to pressure, a pump flow chart cannot provide easy answers. Here, KNF sales engineers are happy to assist in finding the ideal pump.
The Importance of Reading Pump Curves
The importance of reading pump curves is vital and should not be underestimated. A pump performance curve chart is a valuable tool for selecting and operating a pump in a specific application, providing the data for optimal pump and system efficiency and performance.
It should be noted that pump curves will differ between different pump types as they have different internal workings. Therefore, correctly reading a pump curve chart is crucial to effectively selecting and operating a pump, allowing for more informed decisions, and helping extend the pump's life by avoiding overloading or operating the pump outside its optimum range. These factors help achieve better performance, efficiency, and cost savings.
How To Read a Diaphragm Pump Curve
Correctly sizing a pump to the application requirements can be a complex and often confusing process. But doing so will account for multiple factors, including fluid types, ambient temperature, fluid temperature, elevation changes, the tubing’s length, diameter and type, and any joints or bends in the hydraulic system – all of which require a complex understanding.
In certain circumstances, estimated flow and pressure difference requirements may already be known. In this case, a pump curve chart can provide additional information to understand if the pump can operate effectively within the boundaries of the application. A pump curve chart can be used for diaphragm pumps to narrow down the choice and make a fast decision.
To read a diaphragm pump curve chart correctly, we have listed the following definitions to better understand the terms used and the variables to look out for:
- Title box: This area at the top of a pump curve chart provides detailed information about the pump model, its size, and other specific identifying criteria, such as the pump material (stainless steel, PP, PVDF, PTFE, etc.). When inspecting the performance of an existing pump, always ensure the pump matches the relevant curve chart.
- Flow axis: The flow rate of the pump refers to the volume of liquid or gas it will transfer per minute. It is usually measured in liters per minute (l/min) and indicates the volume of gas or liquid moved in a particular time. The vertical y-axis indicates the specific flow rate.
- Pressure axis: The pressure axis is divided into two sections: vacuum (left side) and pressure applications (right side). For vacuum applications, the x-axis defines the absolute pump inlet pressure whereas the outlet pressure is set constant to 1000 mbar absolute. For pressure applications, the inlet pressure is kept constant to 1000 mbar and the x-axis defines the relative outlet pressure to the inlet pressure. When calculating the pressure requirement, other factors should be considered. These include the flow rate and any resistance factors, such as changes in elevation or the number of bends in the fluid system. The horizontal x-axis indicates pressure on the pump curve chart.
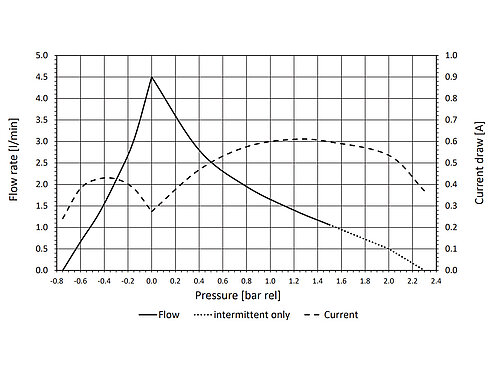
- Current draw: More detailed pump curve charts show the pump’s current draw along all operating points. The current draw is measured ampere (A) or milliampere (mA).
- Minimum flow: Some charts also show the pump’s minimum flow which is the minimum flow rate at which it can operate effectively. When the flow rate is too low, the pump may not maintain sufficient suction to transfer the required volume of liquid or gas. Unlike many other pump types, diaphragm pumps cannot be damaged by operating below their minimum flow rate, but backflow might occur, and the pump will not transfer the media properly. Therefore, some pump curves show the minimum flow.
Please note that the data provided in flow charts are approximate values. Measured and tested onsite, pumps can vary in their performance due to several factors such as testing conditions and pump setup.
Pump Performance Matters With KNF
This article should explain how to read pump curves, the terms used, and the variables they can display. As manufacturers of high-quality diaphragm pumps for OEM use, process applications, and lab use where detailed performance pump curves are essential, our KNF technical experts have in-depth knowledge and experience to help our customers understand them better.
If you have questions regarding gas or liquid diaphragm pumps, their performance curves, or finding a pump that will suit your application requirements, contact our KNF experts to learn more. We can provide detailed answers and information based on your specifications.

75 Years: KNF Celebrates Company Anniversary
A treasure chest filled with memories, facts and stories. Learn more about KNF’s company history.